| Home | Racing | Training | Rollerskiing | Trails | Weather | Equipment | Forums | Photos & Video |
|
|||||
|
|||||
|
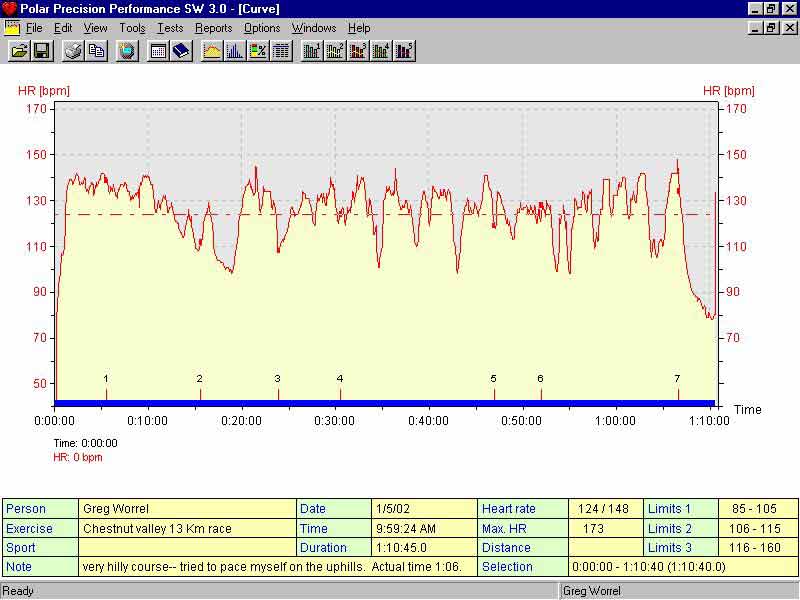
Racing Chestnut Hill was my first race using a new Polar S-710 heart rate monitor which captures heart rate data every 5 seconds. It stores many hours of data which can then be uploaded to a computer and saved in a workout diary and analysis program that Polar provides. This particular model also has cycling functions, an altimeter, and thermometer. Unfortunately, I didn't have the altimeter turned on for this race. The graph of heart rate versus time is one of several ways of looking at the data that has been captured.
I started the heart rate recording about 30 seconds before the start so I could make sure it was working properly. I didn't want to be looking at my wrist and pressing buttons while furiously double poling at the start. I also forgot to turn it off immediately at the end so there are a few extra minutes there. My actual time in the race was 1:06:25 which puts me squarely at the back of the pack. I was not dead last, but not far from it. The heart rate recording shows a very quick rise at the start from around 70 up to 139 beats per minute (bpm) within a minute of the start. It stayed between 130 and 140 for about the first 10 minutes. I know for some of you, if not most of you, 140 bpm is a heart rate you see when you're getting dressed for the race or walking from the parking lot to the starting line. For me, 140 bpm is a heart rate I rarely see in training. Bounding up the toboggan hill at Kensington will get me there, but it takes an extreme effort while roller-skiing on the bike trail to get my heart rate anywhere near 140. Just for reference, my resting heart rate is about 35. My maximum heart rate was measured at 173 four years ago during a VO2 max test which also measured my VO2 max at 62. When I looked at my heart rate monitor soon after the start, I was surprised at how high my heart rate was. I didn't feel like I was pushing that hard. In fact, I was deliberately going a little easy to pace myself. My anaerobic threshold is probably around 125 bpm so high lactate levels soon set in to make me realize I really was at race pace. At the bottom of the graph there are some markers labeled 1,2,3, etc. These are lap times. I didn't see every sign, but there were signs on the trail that I took to be km markers. My first km time was 5:33. I missed the number two marker, but I pressed the lap time button to mark the next two kilometers 10:03 later. If the race was 13 km, then I averaged about 5 minutes per kilometer and my pace was fairly consistent from start to finish. I can do miles at that pace on the bike path on rollerskis. I guess we're not in Kansas anymore. I am almost ashamed to admit it but there were two or three times near the end when I actually stopped to recover a little in the middle of a hill. I promise I will never do it again. It probably didn't affect my time much though. I have charged up hills in the past only to be so maxed out at the top that I was reduced to a crawl. My maximum heart rate during the race was 148. My average heart rate was 124. The average was probably a little higher if you lop off the 4 minutes after the finish at the end while I was still recording. Many experts define lactate or anaerobic threshold as the average heart rate for a 1 hour race. Since this race took me just over 1 hour, this is a useful number. Anaerobic threshold is widely believed to be more important than VO2 Max in determining athletic performance. Training at or around anaerobic threshold level is one way to raise it. A higher anaerobic threshold means a higher racing pace. I am still learning to use this new heart rate monitor. At the very least, it is an interesting toy. We will see if it makes me any faster. -Greg Worrel |